From Outcomes to Insights: 4 Best Practices in Outcomes Storytelling
Take-away: Since there is no common agreement on what an “optimal” outcomes report entails, providers and supporters must recognize and embrace the flexibility and effort that is required to meet outcomes reporting expectations that wildly vary. This newsletter presents four best practices that simplify this effort, potentially saving the community thousands of hours and millions of dollars annually.
As a result of our initial “Future of Outcomes” outreach in late July, we have had more than 40 discussions with supporters and providers. While many discussions began by simply reviewing the general take-aways from our White Paper, subsequently we have been asked to dig a bit deeper into reviewing confidence-based assessment outcomes, behavioral engagement data, and readiness to change measures from specific projects, clinical areas, and even complete provider programs. These practical discussions reveal two things: 1) the community of providers and supporters are collectively starving for more effective ways to tell their outcomes story, and 2) we are far from having common reporting expectations which, as a result, continues to create significant tension and frustration across the community.
The Varied Range of Outcomes Report
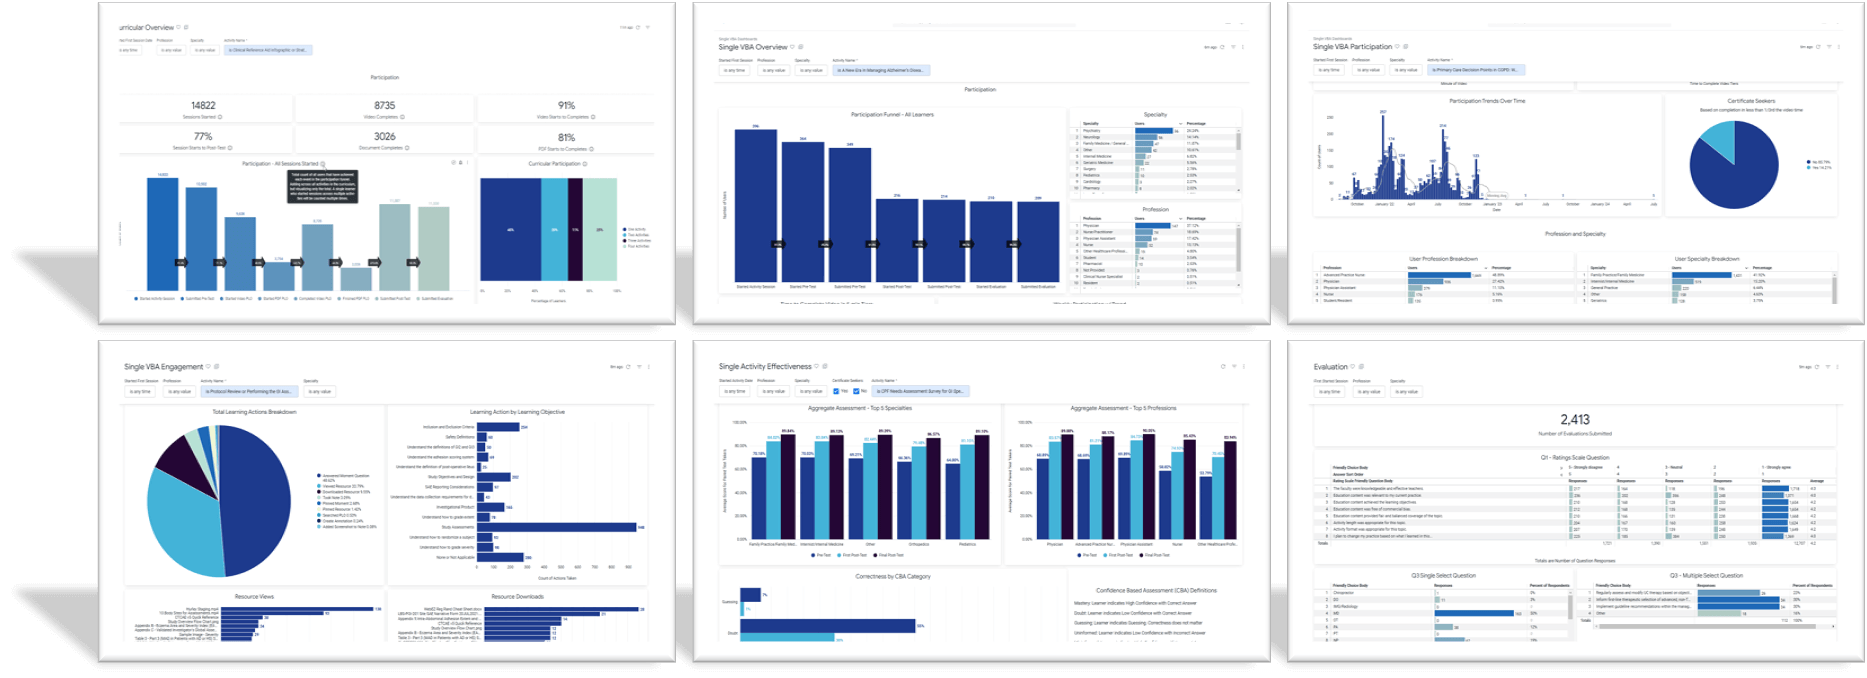
For nearly 12 years ArcheMedX has provided our partners with real-time, 24-hour access to up to six different, intentionally designed Ready outcomes dashboard. These dashboards include hundreds of data visualization and granular data tables each designed to simplify outcomes efforts. All data, analyses, and visualizations are aligned with the Outcomes Standardization Project, but they include much, much more. Between the visualizations and the granular data table there are few, if any, outcomes-related questions that can not be answered. And all dashboards are filterable by user Profession, Specialty, and date. There is literally nothing like it in CME/CPD.
But having access to this treasure trove of data is just the beginning. Once the data is generated and the dashboards are consumed its ‘Reporting” time…and this is where things can often seem paralyzing. Does the data need to be entered manually into a grants management system, does it need to be summarized into a single-slide template, does a narrative report need to meet a strict page limit before being uploaded, can it be presented in person, how about interpretive dance….🕺💃!
Now rinse-and-repeat for every project, for every supporter, every milestone, month, or quarter. If you ask a dozen supporters how (and when) they ‘require’ outcomes reports you will get two dozen answers. Go ahead and try it, I did 😉
Best Practices in Outcomes Report
Over the past few years, we have worked hard with providers and supporters to find the most common ground. This work has led to the creation of outcomes reporting best practices which come directly from the providers who have had the most success and the supporters who are most satisfied. The best practices won’t be a miracle cure 100% of the time, but they’ll ensure a core reporting structure that can then be efficiently altered as needed.
#1 – Begin with the most complete data model and experience you can engineer. Obviously this is a strength for us at ArcheMedX, but the more robust your data model is, the more seeds you have from which to sow your outcomes story. Invest upfront in the model and you’ll reap the benefits many times over!
#2 – Ensure that your core outcomes methods, measures, and analyses are clearly articulated in your planning and proposals. For every educational intervention there are literally 1000s of questions that could be asked of the data after the fact – but good outcomes science happens within a predefined and structured framework. I spend as much time in data tables as anyone I know – trust me: you have to plan, focus, and ruthlessly prioritize.
#3 – Create a holistic reporting framework that effectively communicates not only your outcomes data, but also your insights (what does it mean?). At this point your core outcomes methods, measures, and analyses should be your guide. Sure, lean into the Outcomes Conceptual Framework (Moore 2009), but also recognize its limitations. Your reporting framework should be principally driven by what you intended to measure and what unique methods and analyses you leveraged.
#4 – Remember the adage, “Contrast creates meaning.” The best insights never come from purely descriptive outcomes, but from how these outcomes compare or contrast to other datasets. Leveraging things like segmentation, effect size, or benchmarking data, routinely spark the most meaningful insights.
Here is a snapshot of how we recommend our partners bridge the chasm from data to storytelling – this is our Ready Reporting Template – our holistic reporting framework. It’s a nearly perfect balance of simplicity, rigor, and most importantly, storytelling. Eight-to-ten slides, each self-contained, with simple design, and a balance of data and narrative. (And for the visual design nerds, each slide averages nearly 80% white space!)

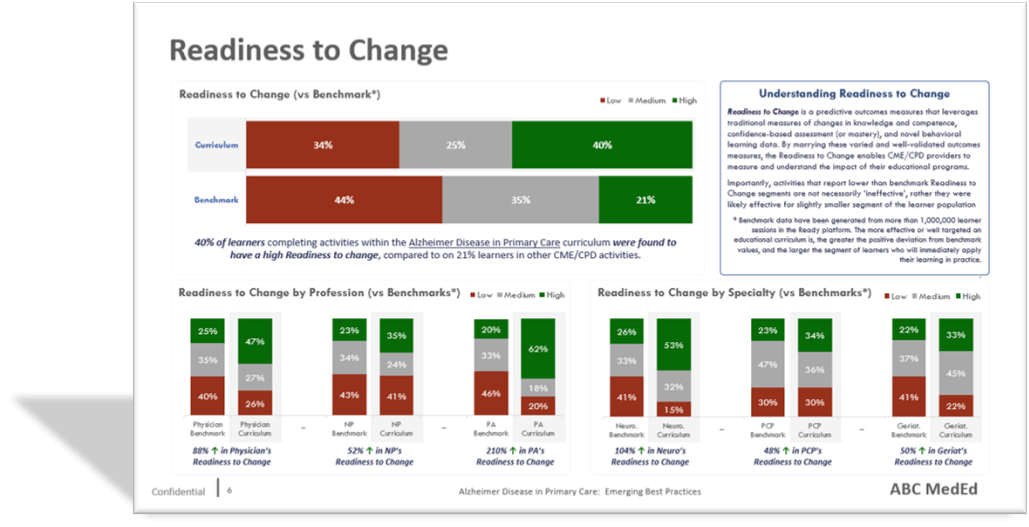
More specifically, as an example of just one element of the Ready Reporting Template, here is our new Readiness to Change ‘report’ slide:
Upper right: brief narrative explaining the methods and measures.
Upper left: comparison of aggregate Readiness to Change outcomes vs historic benchmarks.
Bottom left: comparison of Readiness to Change for the top three intended professions.
Bottom right: comparison of Readiness to Change for the top three intended specialties.
Notice that each of the three data visualizations is supported with the most relevant insight.
——- | ——-
After 20+ years of pioneering approaches to outcomes science and reporting, both as a supporter and a provider, I’ve come to the conclusion that there is far too much complexity and variability for the community to ever truly standardize a reporting approach. We CAN standardize methods and measures, but NOT the way we tell our stories. My goal is that by sharing these outcomes reporting best practices and our example Ready Reporting Template, we collectively move closer and closer to a viable common ground.
As always, please let me know if you have any questions about the reporting best practices or the Ready reporting template. If you want to chat directly, click this calendar link to find an open time that fits your schedule.


